Calculate S-Parameters in the Frequency Domain
In cases where providing an impedance match is difficult or impossible, you can evaluate the power efficiency of a transmission line using S-parameters. The S-parameters are most commonly calculated in the frequency domain.
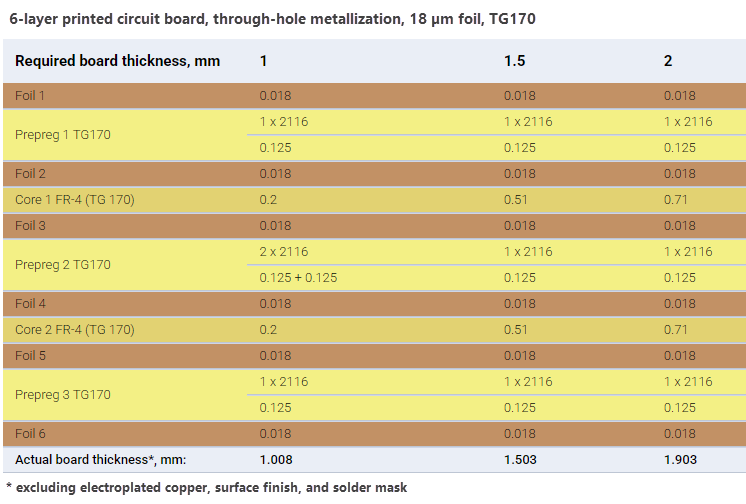
In this tutorial, we'll calculate S-parameters of a microstrip transmission line with a solder mask. This line is located on the first layer of a sample 6-layer PCB stackup shown below. The board thickness is 1.5 mm. The target characteristic impedance of the transmission line is 50 Ohm.
-
First, determine the trace width required to achieve a characteristic impedance of
50 Ohmfor aCoated microstrip (CM-1B)structure, as demonstrated in the Calculate Trace Width tutorial.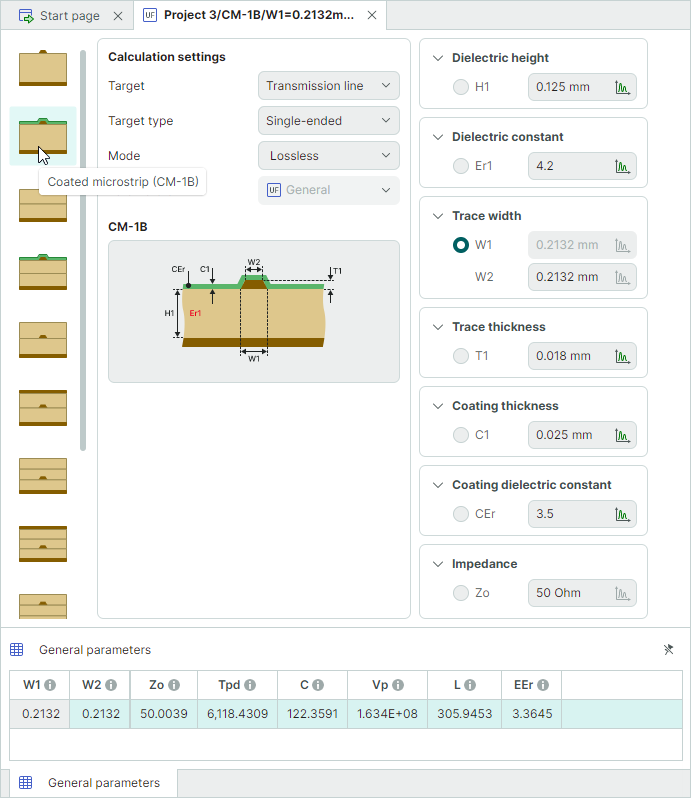
The calculated trace width is
0.2132 mm. -
In the Calculation settings panel, switch calculation mode to
Frequency domainand set the Parameters option toS-parameters. The previously entered transmission line parameters will retain their values.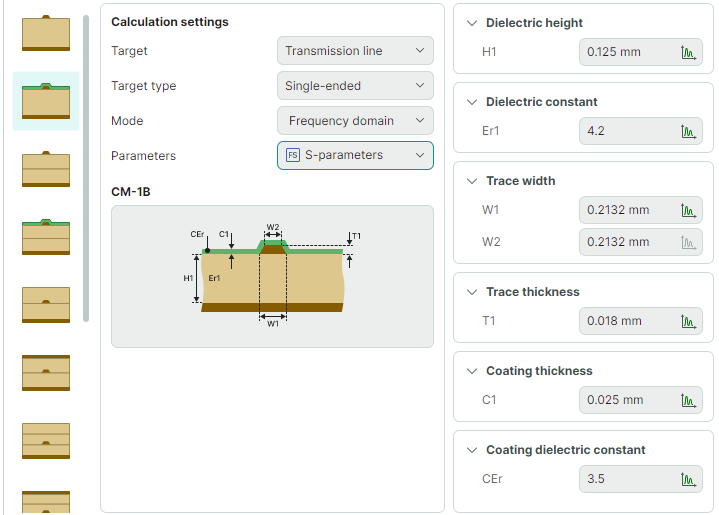
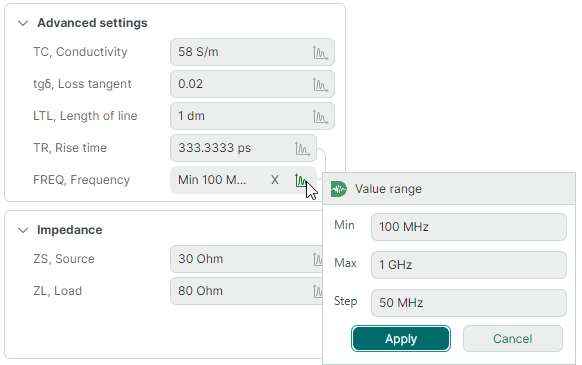
In the Advanced settings panel, set the following parameters:
- Set LTL, Length of line to
100 mm - Set ZS, Source impedance to
30 Ohm - Set ZL, Load impedance to
80 Ohm - Set FREQ, Frequency to a range from
100 MHzto1 GHzwith a step of50 MHz
- Set LTL, Length of line to
-
Run the calculation.
-
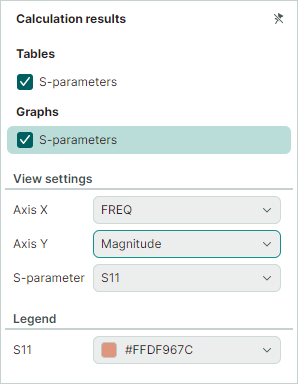
In the Calculation results panel, select the
Graphs → S-parametersgraph, and then set the following settings.- Set Axis Y to
Magnitude - Set S-parameter to
S11
The graph at the bottom of the window shows that the minimum reflected wave level occurs at
400 MHz. At this frequency, the transmission line will perform at its best.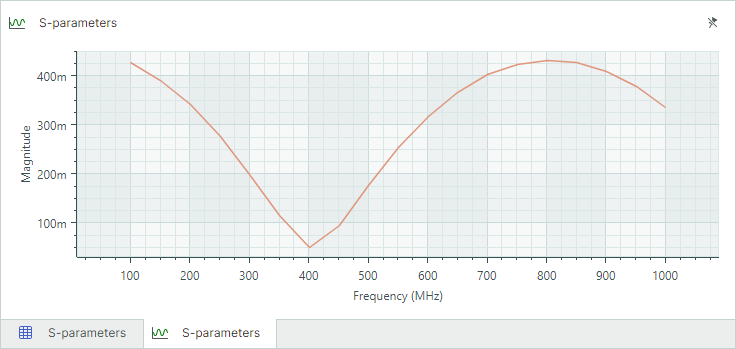
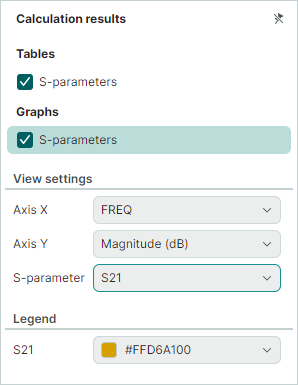
Then set the graph settings to the following values:
- Set Axis Y to
Magnitude (dB) - Set S-parameter to
S21
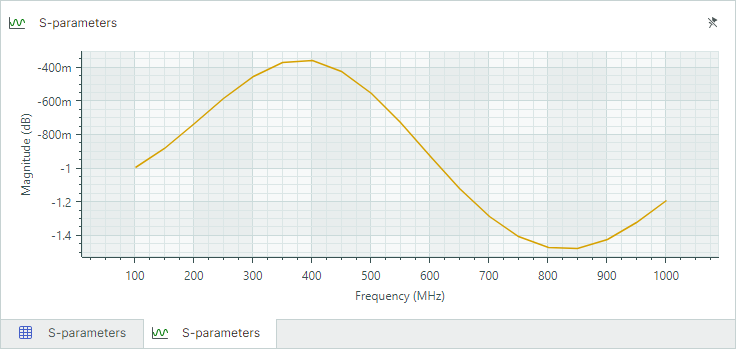
The graph at the bottom will show the transmission line loss as a function of frequency.
- Set Axis Y to